Barclays wanted to transform how they explore, analyse, and share data. With millions of customer transactions processed daily, they saw an opportunity to empower businesses with meaningful insights — presented in a way anyone could understand.
I helped design a platform that makes complex data simple. It enables users to access real-time business insights, unify their data into a single source of truth, and visualise performance through intuitive, dynamic dashboards.
Initial Thoughts
Before diving into design, I focused on defining the core challenges and questions:
● What do businesses truly want to understand about their performance?
● How can we visualise complex data in a clear, accessible way?
● How much detail is enough without overwhelming the user?
● Which platform could best support a proposition of this scale?
● Once chosen, what are that platform’s key features and limitations?
Barclays processes terabytes of data every day, yet only a fraction was being used effectively. The existing solution relied on static, PDF-based reports — inefficient and far from intelligent. This new proposition aimed to unlock deeper insights, giving businesses access to information that was previously out of reach.
Competitive Analysis
At the time, there were few — if any — comparable products offering data-led insights at this scale. This meant my research needed to look beyond direct competitors. I explored adjacent industries and digital products to understand how others approached data visualisation and storytelling.
From this, I gathered inspiration and insights around marketing strategy, layout, usability, navigation structures, content hierarchy, and visual design — all of which helped shape the foundation for Barclays’ new proposition.

Team Setup
Given the scale and complexity of the project, collaboration and clear communication were essential. With multiple workstreams running in parallel, regular onsite sessions and cross-location calls helped ensure everyone stayed aligned throughout the process.
The core team included:
● Product Owner
● Business Analysts
● User Experience Designer (my role)
● Front-End Developers
● Back-End and Infrastructure Developers
● Tableau Project Managers and Representatives
Working Methodology
At Barclays, I was a strong advocate for adopting an Agile way of working — a refreshing shift from the rigid, linear structure of the traditional waterfall approach. Too often, projects would become weighed down by documentation and dependencies before real progress could be seen.
With this project, we embraced Agile from the outset. Short sprints, daily stand-ups, and close collaboration between design, development, and business stakeholders meant ideas could evolve quickly. This approach fostered continuous feedback, faster decision-making, and a genuine sense of shared ownership across the team.
By working iteratively, we were able to validate concepts early, adjust based on real data and user feedback, and ultimately deliver a product that was not only functional but genuinely impactful for Barclays’ clients.
Undertaking
Throughout the project, I played a hands-on and strategic role — leading multiple design activities and ensuring every decision aligned with both user needs and business objectives. My focus was on creating clarity from complexity, fostering collaboration, and maintaining momentum across disciplines.
Key responsibilities included:
● Research: Conducted exploratory and competitor research to understand the market landscape and uncover user needs.
● Proto-personas: Developed quick, insight-driven proto-personas to shape early design decisions and prioritise features.
● Workshops: Facilitated collaborative workshops to align stakeholders, define goals, and validate assumptions.
● Initial Sketches: Translated early concepts into sketches to visualise direction and spark discussion.
● Rapid Prototyping: Built interactive prototypes to test ideas quickly and gather feedback in real time.
● Wireframing: Designed structured wireframes that defined layout, information hierarchy, and interaction patterns.
● User Flows: Mapped end-to-end journeys to ensure intuitive navigation and seamless task completion.
● User Interface Design: Crafted a clean, data-led interface that balanced clarity with visual sophistication.
● Cross-Team Collaboration: Maintained daily communication with developers, analysts, and product owners to ensure consistency and efficiency.
This end-to-end involvement meant I could shape not just the look and feel of the platform, but also how it functioned and evolved through each stage of development.

Design Thinking Workshop
This was our opportunity to step back and untangle the project as a team — to ensure everyone shared the same understanding and direction before diving into detailed design. Using Googles Design Sprint framework as a guide, I led a series of collaborative exercises aimed at maximising creativity, surfacing hidden insights, and building collective ownership of the proposition.
We began with a complete overview and an open “brain dump” of everything we knew about the project. This involved engaging with business SMEs to capture deeper insights into the data, the audience, and the commercial goals behind the platform. From there, we defined our north star — outlining clear goals, measurable outcomes, and potential success indicators.
Working backwards from that shared vision, the team was able to identify dependencies, challenges, and opportunities early on. We then moved into active ideation — brainstorming, sketching, and rapidly visualising ideas. These sessions not only helped us clarify our direction but also created a strong foundation for the user experience that followed.
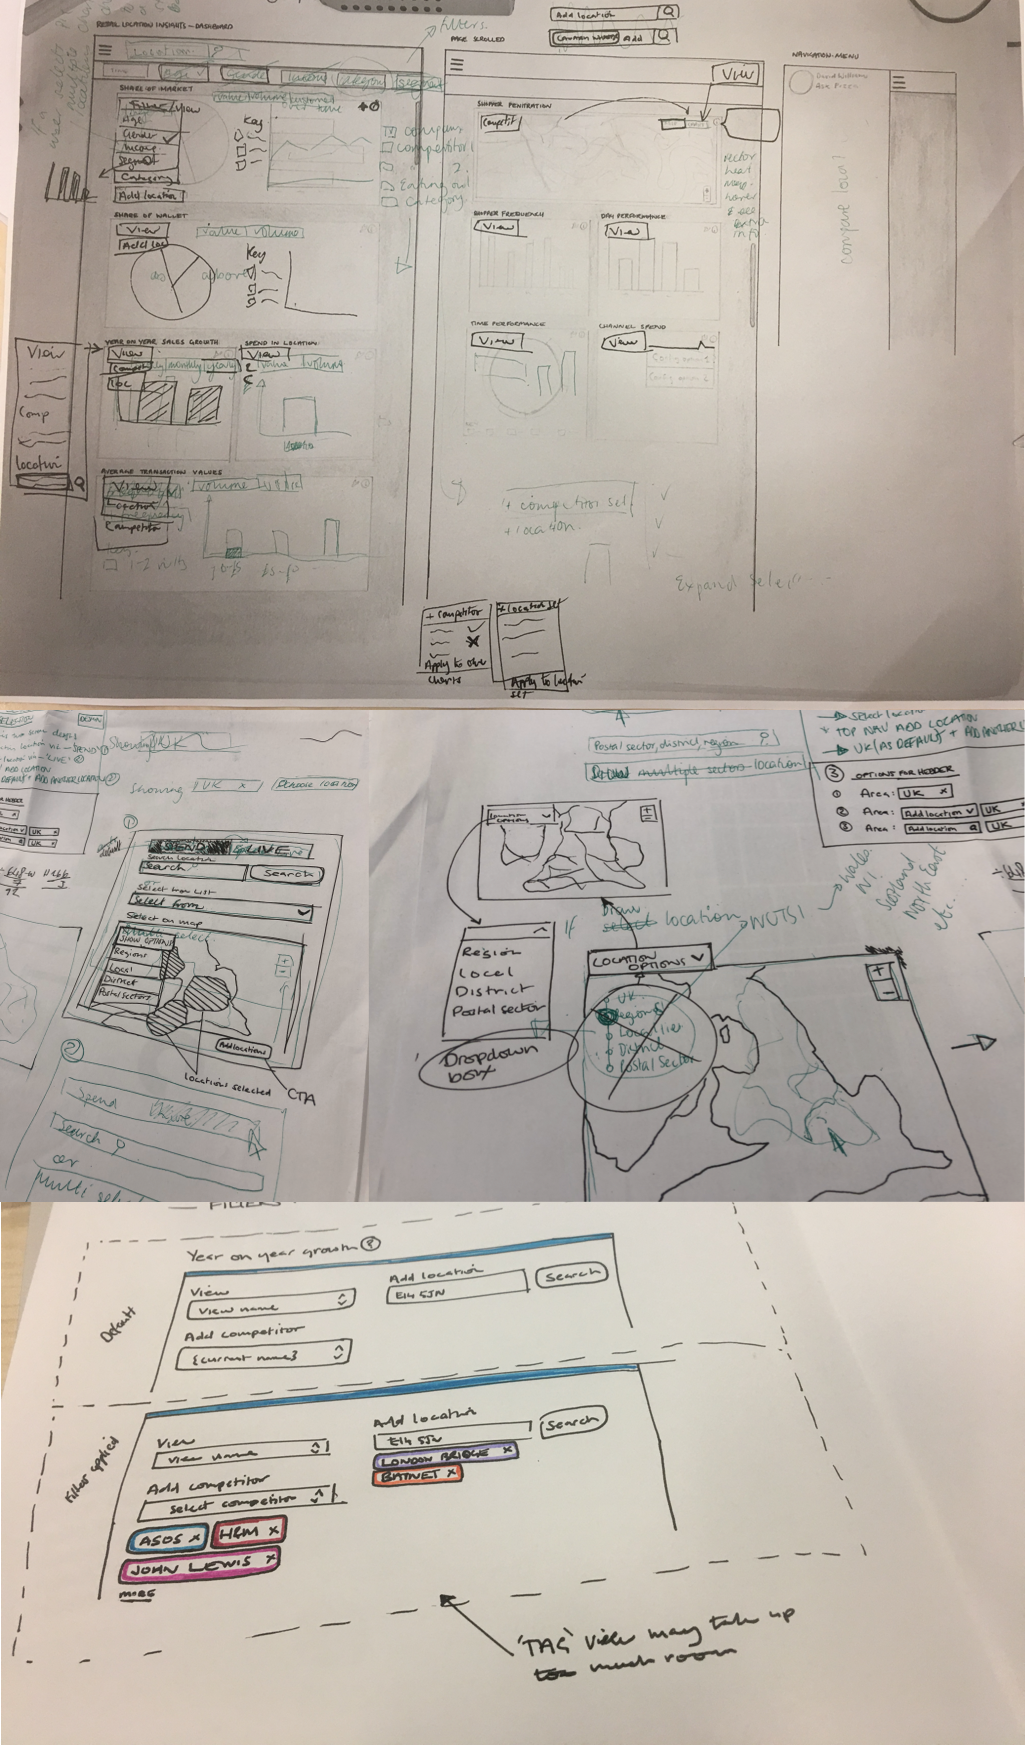
Early Sketches
Once I had a clear understanding of our goals and direction, I began developing a series of initial sketches to explore layout and hierarchy. My focus was on the dashboard — the central hub where users would access and interpret their business insights.
Because the experience was being designed for web, I could take advantage of vertical space to present information in a more fluid, scrollable format rather than being confined to a fixed viewport. This gave the data more breathing room and allowed for a natural visual flow from summary to detail.
I shared these early scamps with the wider team to align thinking and spark discussion. Although the sketches were intentionally rough, they provided just enough structure to visualise the concept. We annotated, scribbled over, and iterated on them collaboratively — a process that helped transform abstract ideas into something tangible and directional.
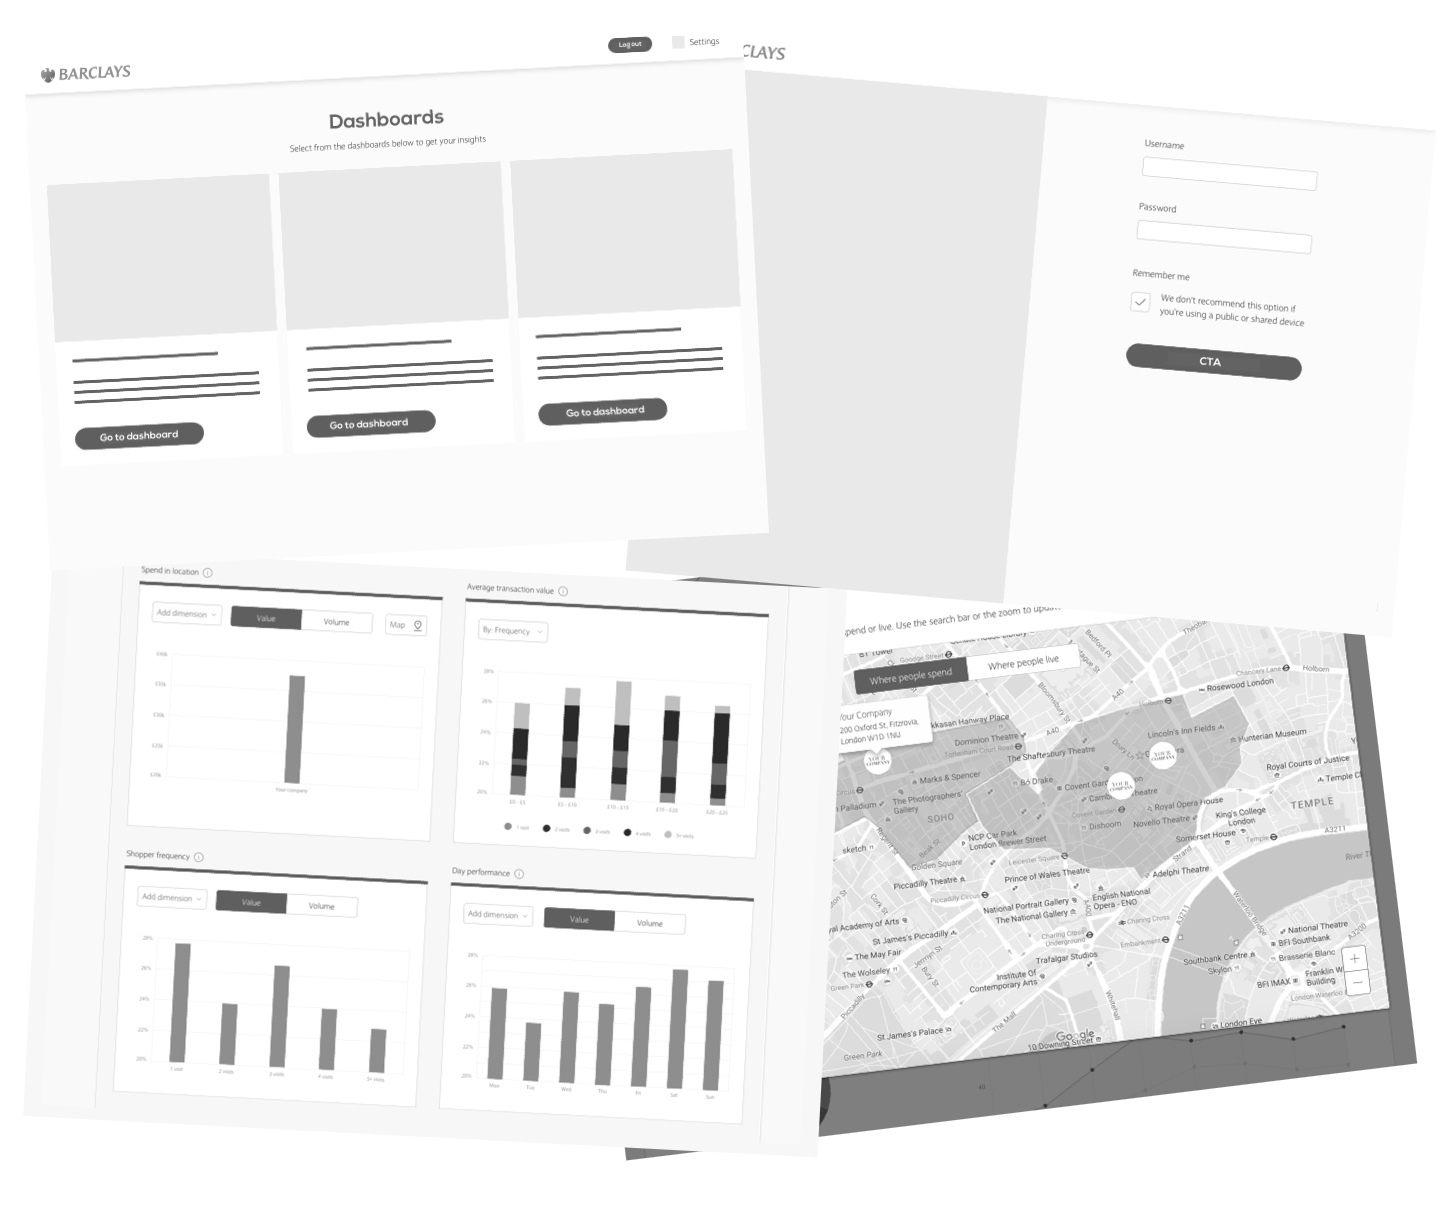
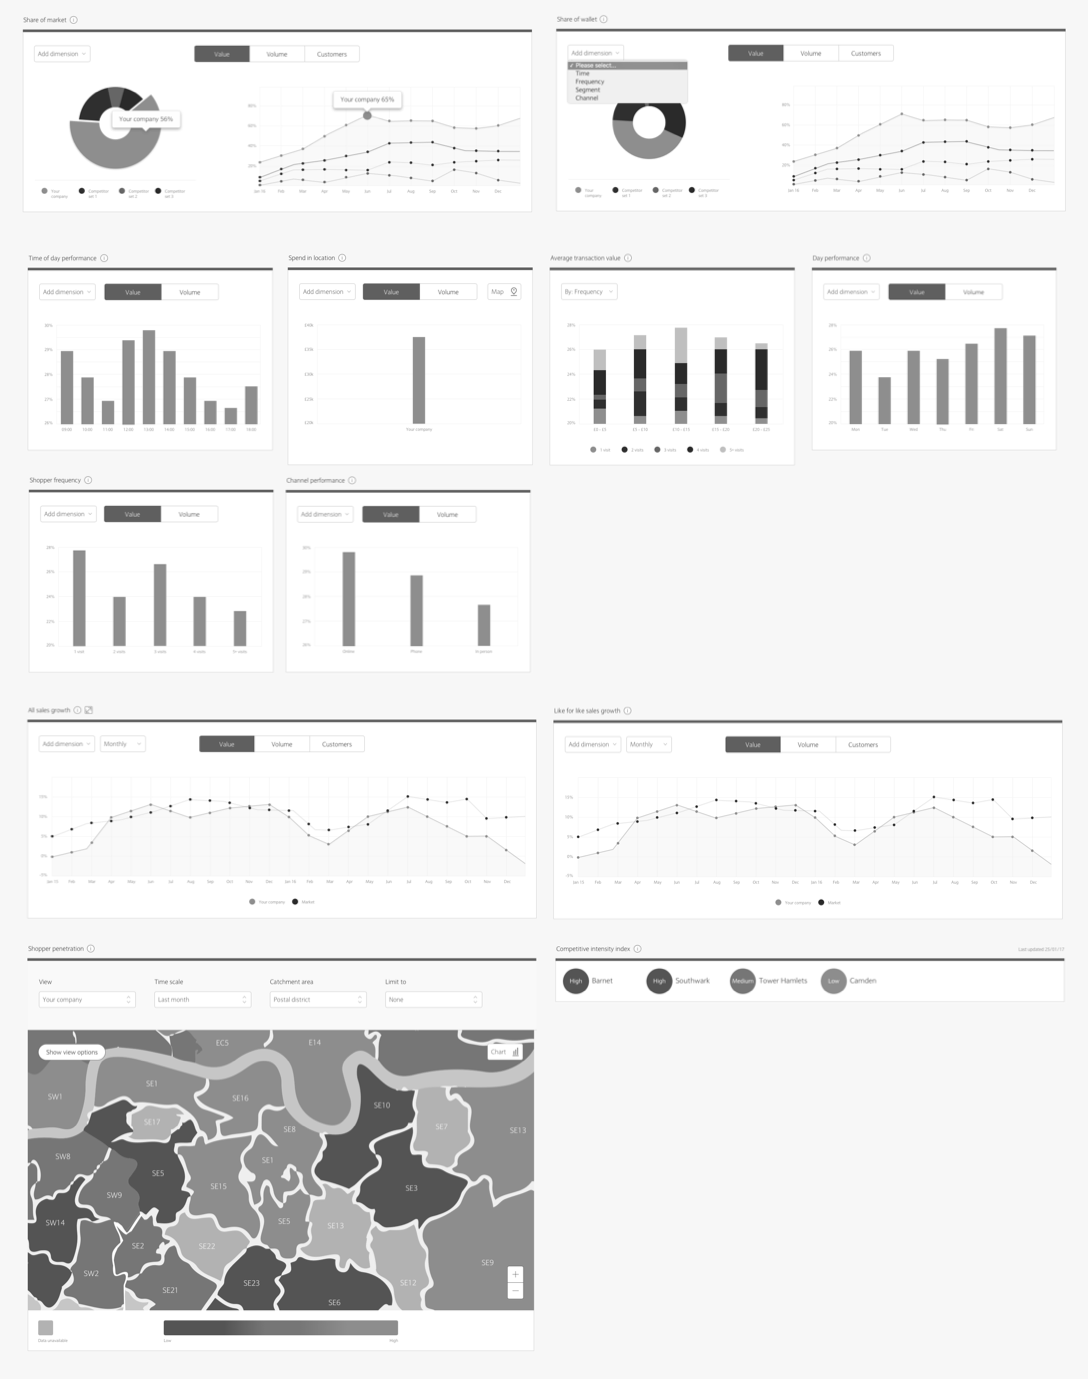
Wireframes
After refining our direction through sketches and discussion, I began translating ideas into higher-fidelity wireframes. These provided a clearer representation of structure, hierarchy, and functionality — a crucial step in aligning the design and development teams.
The wireframes served as an effective communication tool, particularly when catching up with developers. By sharing these early layouts, the team could visualise how the data and interface would come together, even as backend development was still underway.
I’ve always found it invaluable to involve developers at this stage rather than waiting until final UI designs are complete. Early collaboration helps identify potential technical constraints or time limitations upfront — saving countless hours and ensuring that what we design can be built efficiently and effectively.
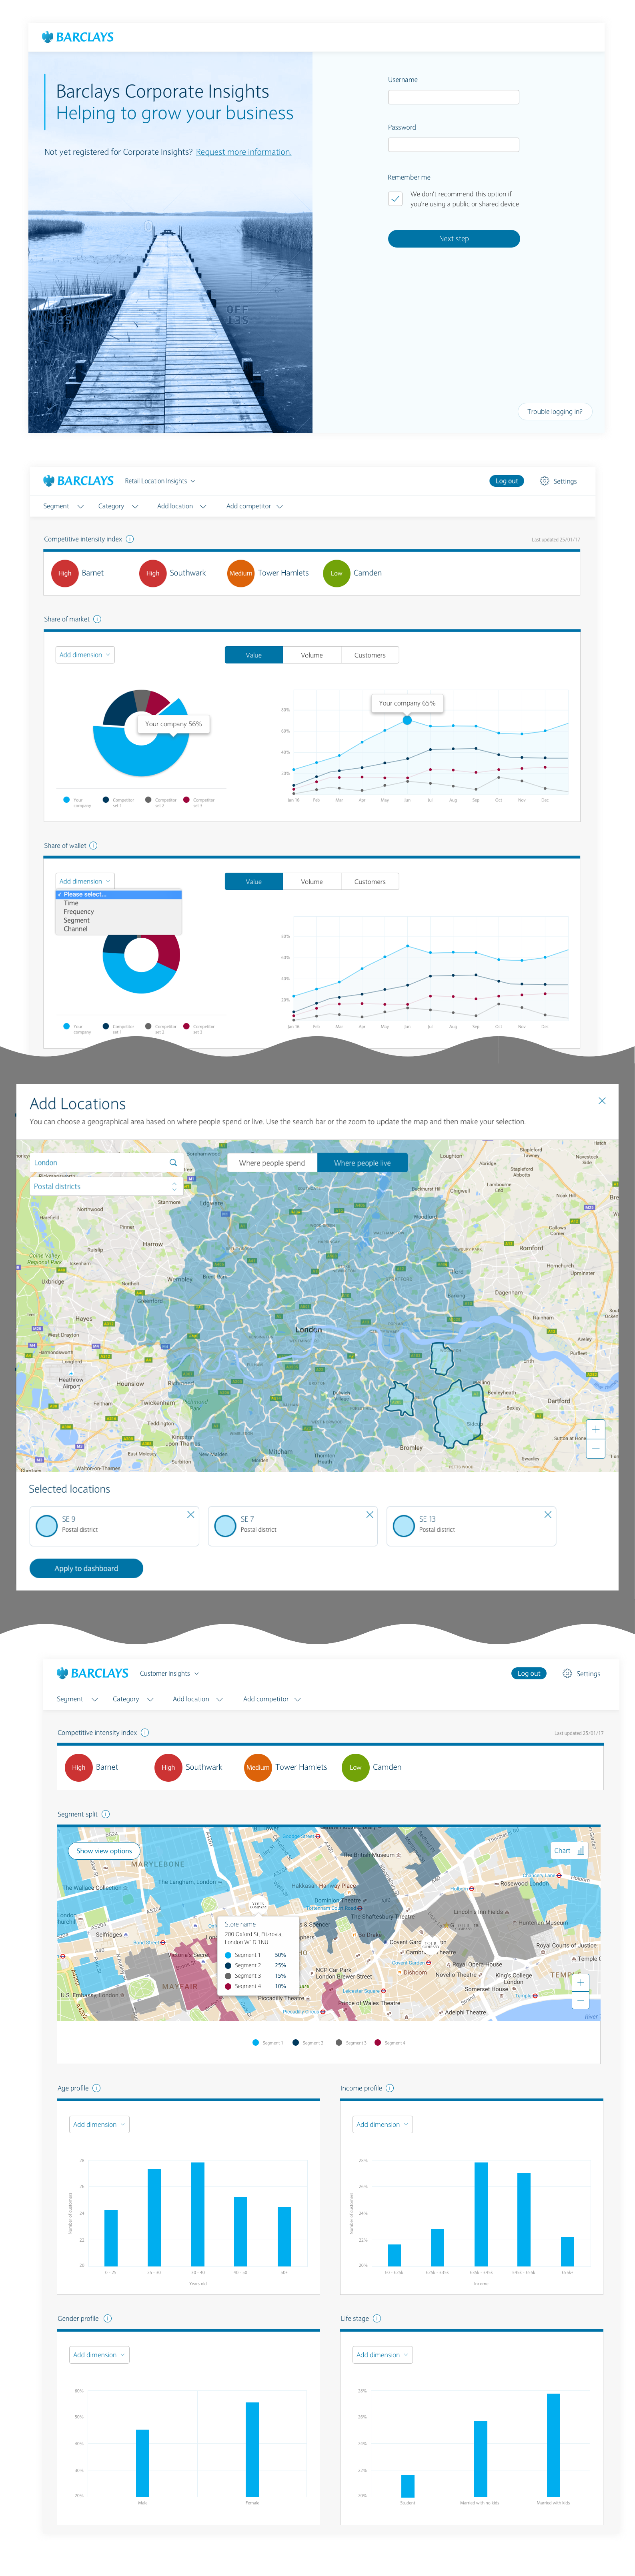
Visual Design
After several iterative cycles of review and refinement, the wireframes evolved into fully realised user interface designs. Following Barclays’ established brand guidelines, I created a visual system that felt both familiar and forward-thinking — aligning with the brand’s identity while modernising its approach to data presentation.
Accessibility played a key role in every design decision. I carefully considered colour contrast, typography, and hierarchy to ensure clarity and inclusivity across all components. The dashboard was designed to present complex data in a way that felt approachable, using visual cues and balanced spacing to guide users naturally through the information.
The result was a clean, professional interface that combined function with finesse — transforming dense datasets into meaningful, visually engaging insights.
Prototype and User Testing
To evaluate the product’s usability and clarity, I conducted a series of moderated user testing sessions. The participant group included a balanced mix of business owners and performance analysts — individuals who regularly engage with data to make strategic decisions.
Using an interactive prototype built in InVision, I aimed to assess the overall ease of use and intuitiveness of the experience. While the prototype offered limited functionality, it was sufficient for testing key flows, navigation patterns, and data comprehension.
Participants were asked to complete a series of pre-defined tasks, such as locating specific insights, interpreting performance metrics, and exploring dashboard features. This approach revealed how effectively users could navigate the interface, uncover information, and understand the data presented.
A dedicated moderator facilitated each session, ensuring participants remained focused on the task while I observed remotely. This setup allowed me to capture unbiased reactions, detailed behavioural notes, and subtle pain points that might otherwise have gone unnoticed.
The insights gathered from these sessions directly informed the next design iteration — refining both interaction design and content hierarchy to enhance usability and comprehension.
Conclusion
The final product successfully empowered business owners with real, actionable insights — transforming raw data into a powerful decision-making tool. It was a rewarding project that blended technical complexity with human-centred design, and while the journey wasn’t without its challenges, it delivered meaningful impact.
This experience reinforced a vital lesson: the strength of the team defines the strength of the outcome. Collaboration, open communication, and trust were central to our success. The Agile approach proved invaluable in managing such a large-scale initiative, enabling us to adapt quickly, validate often, and maintain momentum throughout.
Ultimately, the project showcased how thoughtful design and collaboration can turn complexity into clarity — and data into understanding.
Learnings
#1 Agile’ish
Our team structure allowed for quick decision-making, flexibility, and a strong sense of autonomy — at least in theory. In practice, while we embraced many Agile principles, we were still operating within a traditional waterfall hierarchy. Regular reporting lines and senior sign-offs often slowed momentum, reminding me that culture change is just as critical as process change when adopting Agile ways of working.
#2 The Developer Loop
The development team was based overseas — a setup I was already familiar with. However, this project highlighted the challenge of maintaining clarity across time zones. Early alignment sometimes gave way to misinterpretation; features that seemed feasible during discussions occasionally proved technically unviable once work began. This led to repeated design revisions and additional sign-off cycles. It reinforced the importance of maintaining continuous, transparent communication and documenting every decision — no matter how small — to keep everyone aligned.
#3 A Design System That’s Not Set in Stone
Barclays’ evolving design system proved a valuable foundation for building a consistent interface. However, as it was still in its infancy, it didn’t yet account for the level of data visualisation we needed. This created opportunities to expand it — introducing new patterns and components tailored for data-heavy contexts. I worked closely with the central design system team to feed these updates back, helping to strengthen the system for future projects.